Ethereum Accumulates: Is a Bullish Turn on the Horizon?
Ethereum Breaks the $3,000 Barrier!
Well, well, well! Ethereum has finally sauntered above the fancy $3,000 mark, giving all of us a sigh of relief after a not-so-fun rollercoaster of indecision. But before we start celebrating like we just won the lottery, let’s remember that this price action is just the tip of the iceberg when it comes to getting back on track to that big ol’ uptrend.
What the Numbers are Saying
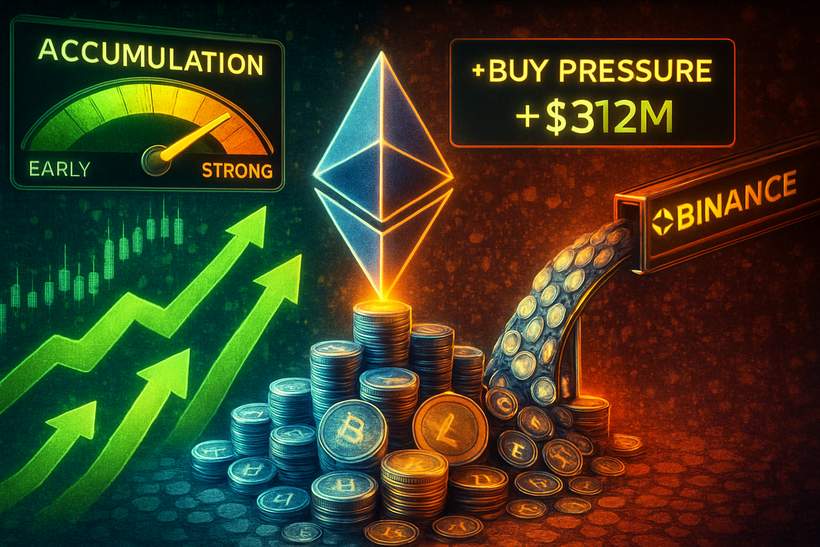
Now, down to the nitty-gritty. Recent analysis from CryptoQuant is raising some eyebrows! Their data shows that Ethereum’s 14-day moving average for the Taker Buy/Sell Ratio on Binance has jumped to a solid 1.005, the highest we’ve seen since July. A number over 1 means that buyers are throwing cash around like confetti, outpacing sellers. This is a signal that traders are getting a little giddy with bullish intentions!
Not Quite a Price Party Yet
But hold your horses! Even with all this buying enthusiasm, Ethereum is still fluttering under its previous all-time highs. So, this increase in purchases isn’t necessarily fueled by monster price gains. It looks more like early birds trying to get their worms before a potential big move happens instead of joining the price-chasing frenzy.
Looking for More Than Just Speculation
But here’s the kicker: just because we see more action in the derivatives market doesn’t mean we’re ready for a full-blown trend reversal yet. For Ethereum to really kick into recovery mode and not just be a flash in the pan, we need more than just some aggressive buying— we need some solid spot demand to back it up and reclaim those higher resistance levels!
A Glimpse into Historical Patterns
CryptoQuant’s analysis also points out that in the good ol’ days, whenever Ethereum’s Taker Buy/Sell Ratio consistently hung out above 1, it often coincided with bouts of elevated bullish activity or the early stages of trend reversals. Looks like there’s a twitch of excitement among buyers who are ready to jump in at the market price instead of waiting around for a better deal.
But Wait, There’s a Flip Side!
However, let’s not get too cozy! The Taker Buy/Sell Ratio mainly reflects what’s going on in the derivatives world. Just because buy pressure is high on the leveraged markets doesn’t mean we’re guaranteed a lasting rally. Without some confirmation from the spot market—like rising volume, net exchange outflows, or solid on-chain accumulation—these price moves could fizzle out faster than a popped balloon.
The Current Landscape for Ethereum
Groovy news though! There seems to be some aggressive buying pulsating in Ethereum’s derivatives market, which might boost the chance of a recovery attempt. Traders need to keep the proactive vibes flowing instead of just waiting to react! Confirmation of a trend shift will hinge on how the prices dance above those key resistance levels while syncing up with broader indicators across spot demand and overall market liquidity.
What’s Next for Ethereum?
Having bounced back above the $3,000 line, we’re looking at a possible short-term cheer, but don’t forget the overall scene remains a bit shaky. On the daily chart, ETH is still beneath its declining 100-day and 200-day moving averages, which continue to play the villain in our story as dynamic resistance points.
The Overall Vibe of the Market
This recent price movement feels more like a breather than a blast-off. The price action is showing limited follow-through, indicating that buyers are a bit hesitant. Even though reclaiming $3,000 is kind of a big deal, Ethereum has had a hard time getting comfy above this level since way back in November. It’s more of a pivot point than actual support!
Stuck in the Range Game
Believe it or not, Ethereum seems to be trapped in a wide range—think of it like a dance-off—between $2,800 and $3,400. The lower side has seen some brave dip buyers, but those little rallies keep hitting walls before they even think about approaching the previous breakdown levels. Talk about a market in limbo—neither the bulls nor the bears seem to have enough oomph to push things in one direction!
What Needs to Happen Next
As for momentum indicators? They’re hinting at stabilization rather than any grand trend reversals. If Ethereum is going to leap back into sustained upward movement, it better reclaim the $3,300-$3,500 range and not just float above those long-term moving averages; we need expanding volume to really party!